Prometheus(二):Prometheus 监控Windows机器
标签:
一、安装wmi-exporter首先在需要监控的Windows机器上安装wmi_exporter。wmi_exporter下载地址:https://github.com/martinlindhe/wmi_exporter/releases
下载后,双击即可完成安装。
完成安装后,会自动创建一个开机自启的服务
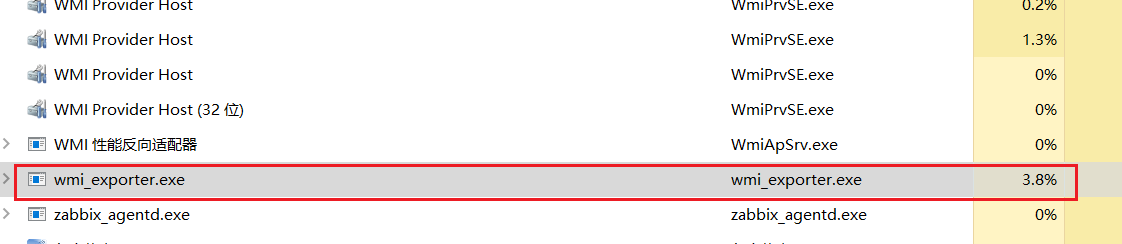
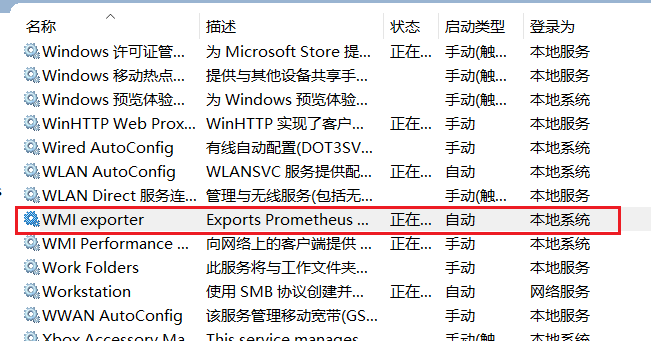
验证服务是否启动,默认wmi-exporter端口为9182
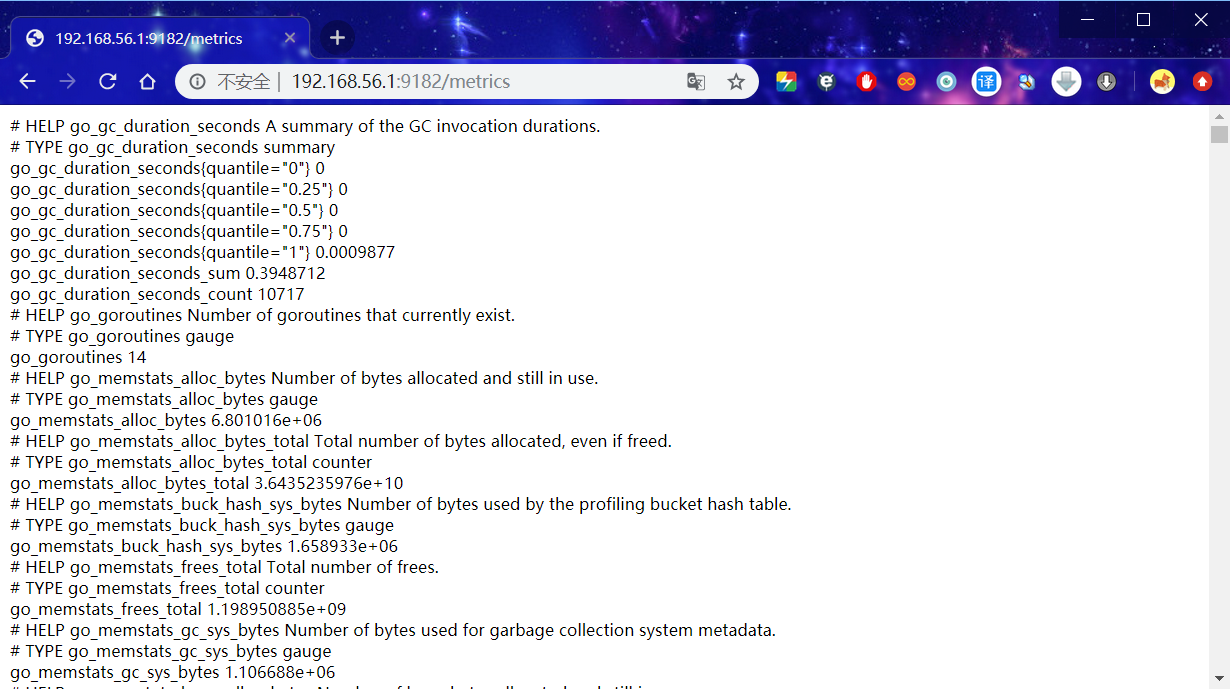
浏览器访问 :9182/metrics (Windows系统IP地址:9182端口),显示数据,则服务开启成功。
进入Prometheus的安装文件夹,打开Prometheus配置文件
# cd /usr/local/prometheus # vim prometheus.yml
在scrape_configs标签下,添加以下内容,配置监控
- job_name: ‘Windows‘ static_configs: - targets: [‘192.168.56.1:9182‘] labels: instance: Windows
以下是Prometheus.yml 文件全部内容
# my global config global: scrape_interval: 15s # Set the scrape interval to every 15 seconds. Default is every 1 minute. evaluation_interval: 15s # Evaluate rules every 15 seconds. The default is every 1 minute. # scrape_timeout is set to the global default (10s). # Alertmanager configuration alerting: alertmanagers: - static_configs: - targets: # - alertmanager:9093 # Load rules once and periodically evaluate them according to the global ‘evaluation_interval‘. rule_files: # - "first_rules.yml" # - "second_rules.yml" # A scrape configuration containing exactly one endpoint to scrape: # Here it‘s Prometheus itself. scrape_configs: # The job name is added as a label `job=<job_name>` to any timeseries scraped from this config. - job_name: ‘prometheus‘ # metrics_path defaults to ‘/metrics‘ # scheme defaults to ‘http‘. static_configs: - targets: [‘localhost:9090‘] - job_name: ‘Linux‘ static_configs: - targets: [‘192.168.56.201:9100‘] labels: instance: Linux - job_name: ‘Windows‘ static_configs: - targets: [‘192.168.56.1:9182‘] labels: instance: Windows
保存退出,重启Prometheus服务
# systemctl restart prometheus
浏览器访问 :9090/targets 查看监控信息
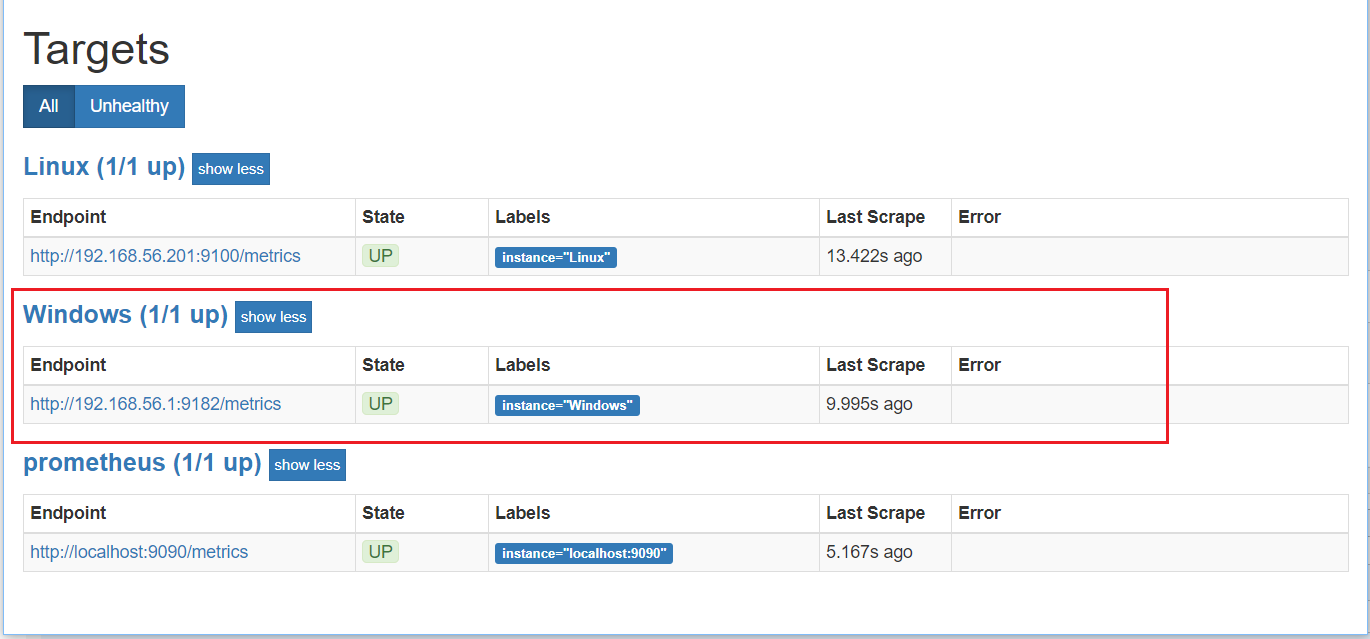
可以看到,Windows机器已经加入进来。
三、配置Grafana添加dashboard
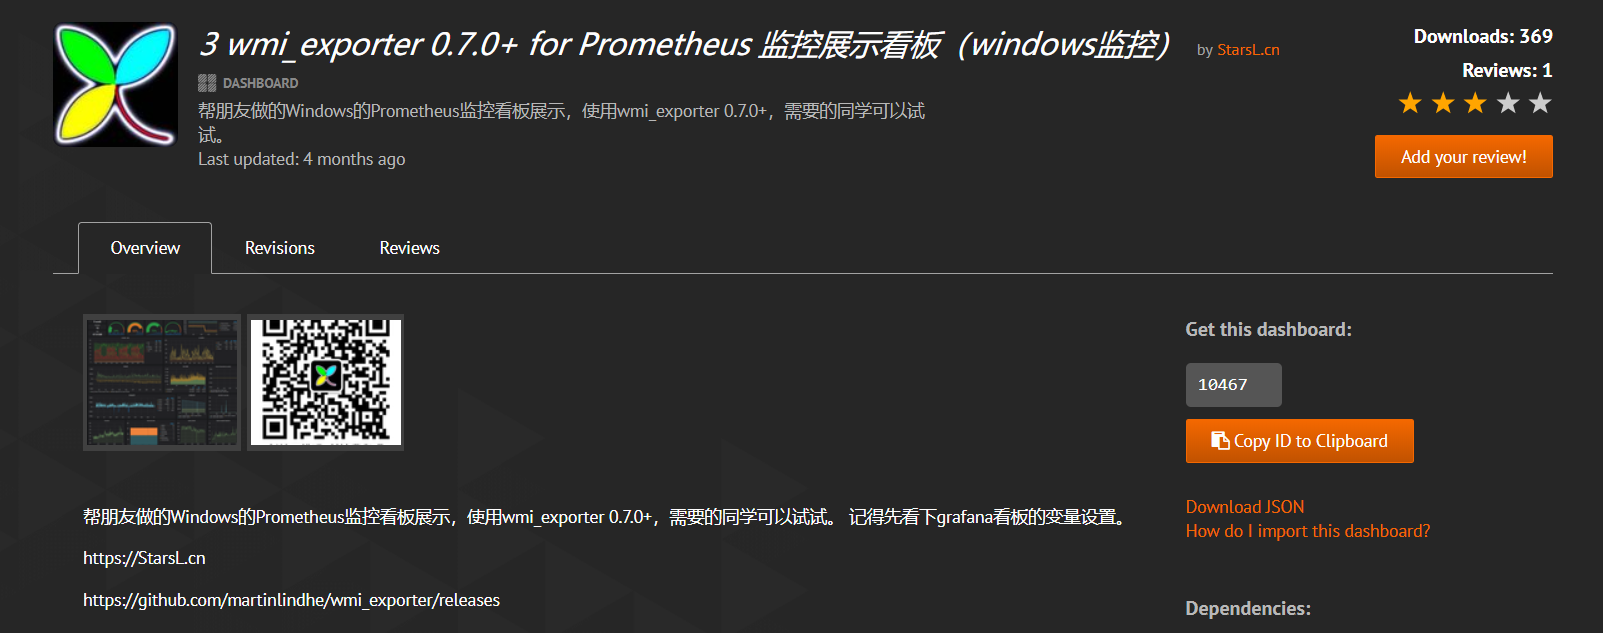
Grafana官方为我们提供了很多dashboard页面,可直接下载使用。浏览器访问 https://grafana.com/grafana/dashboards 下载所需要的dashboard页面
此处我们使用Windows 监控的dashboard,dashboard Id为:10467
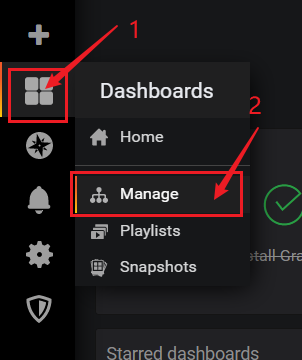
然后打开我们的Grafana监控页面,打开dashboard的管理页面
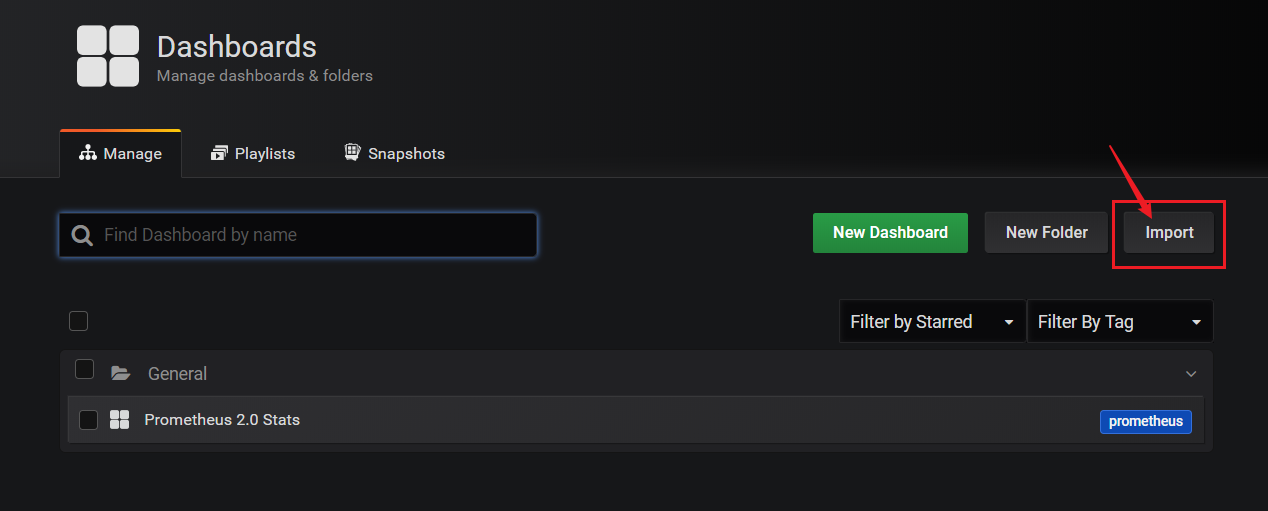
点击【import】按钮
然后将我们刚才的dashboard Id (10467) 复制进去
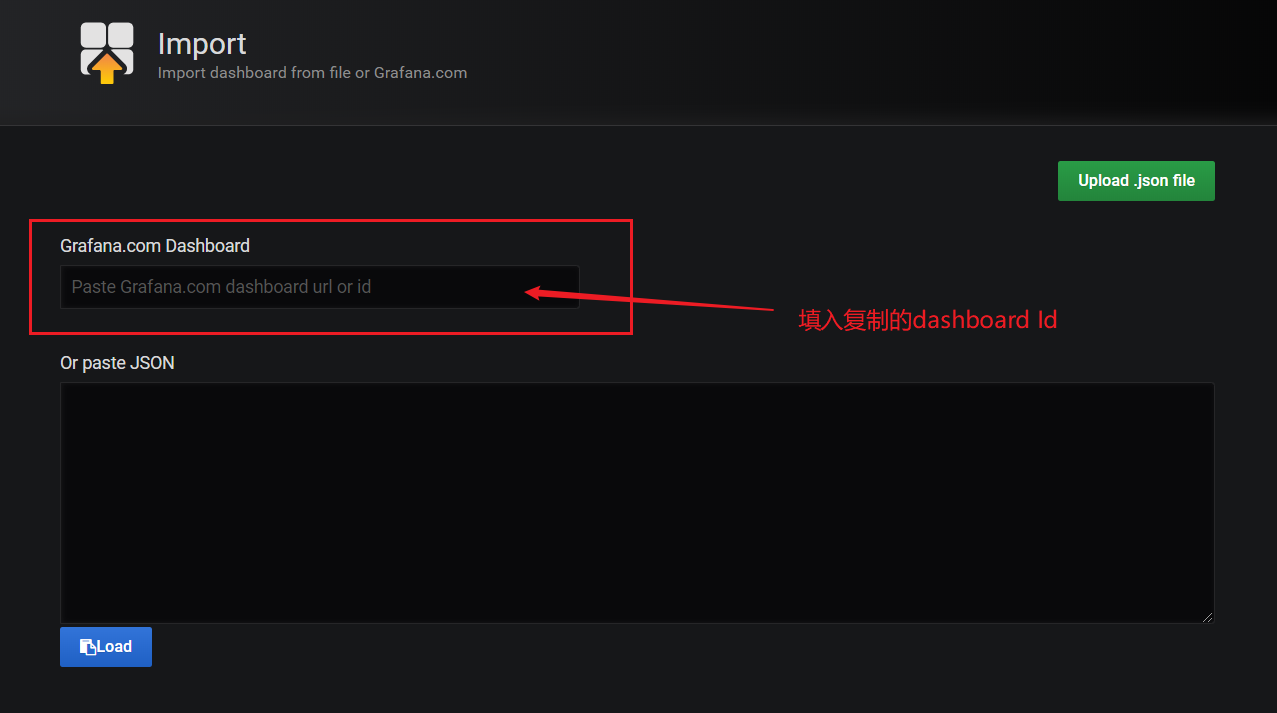
Grafana会自动识别dashboard Id 。
温馨提示: 本文由杰米博客推荐,转载请保留链接: https://www.jmwww.net/file/9755.html


")


与Excel文件之间的导出与导入(")


")