一、自定义模版
1.创建模版
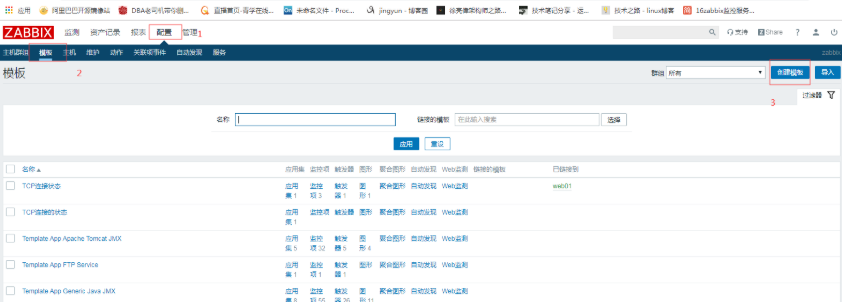
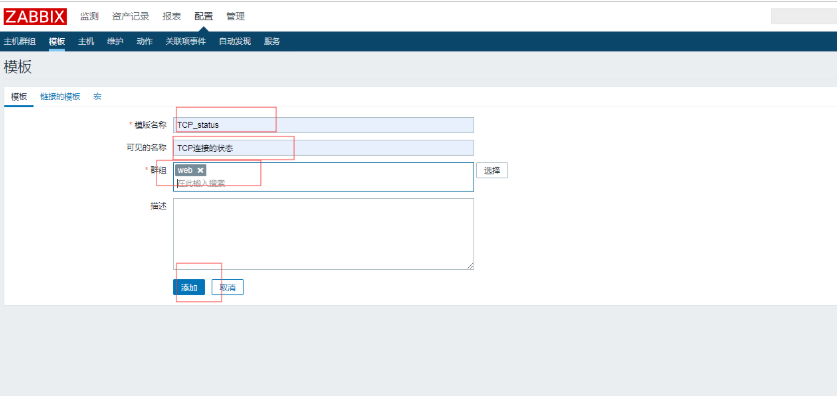
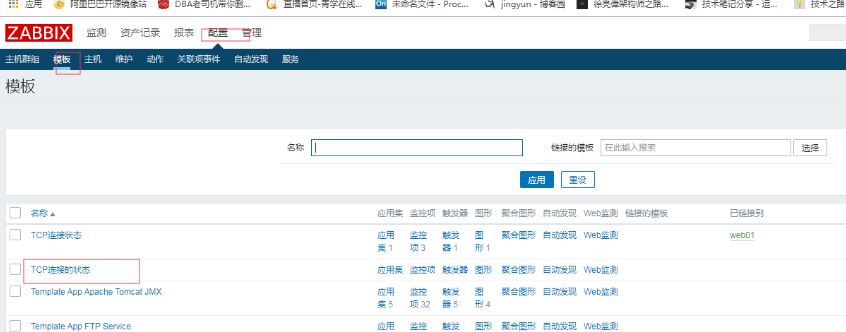

1.1克隆出三台
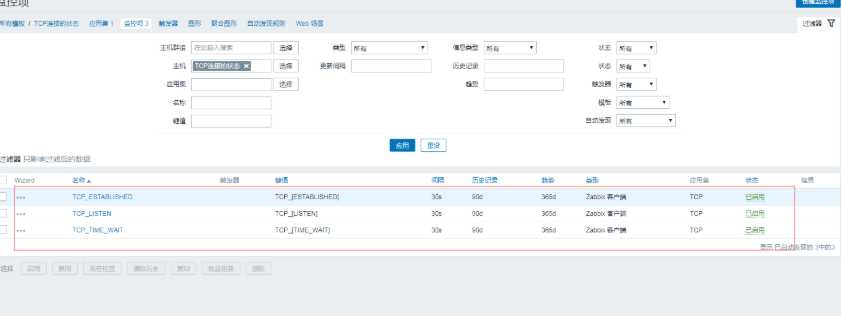
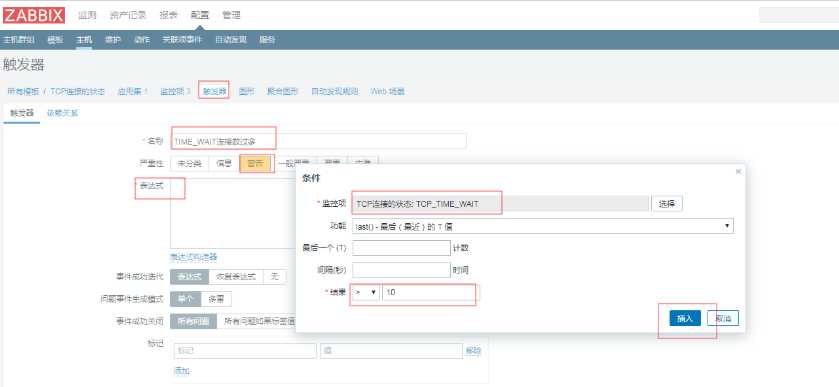
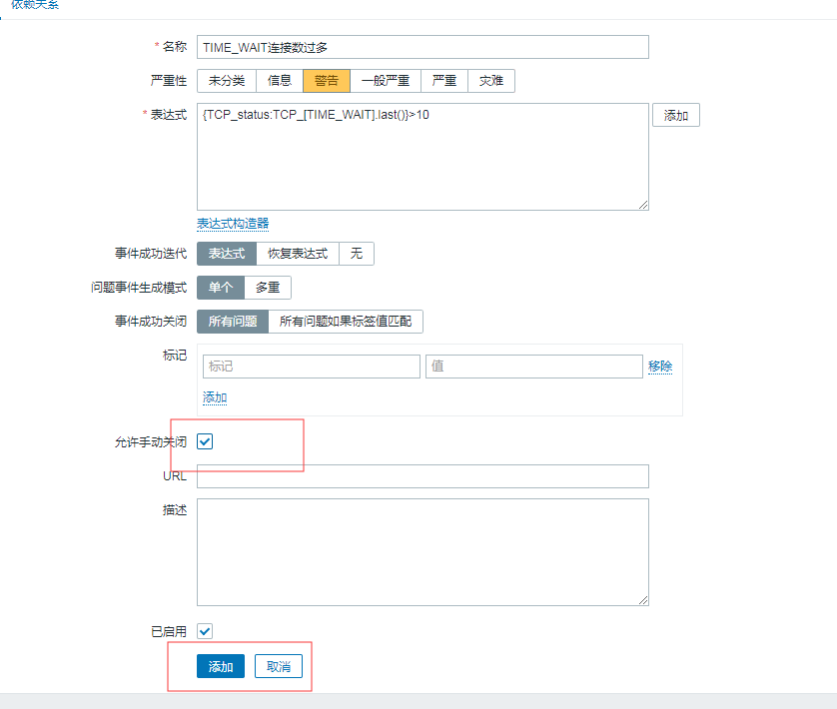
1.2直接创建好触发器


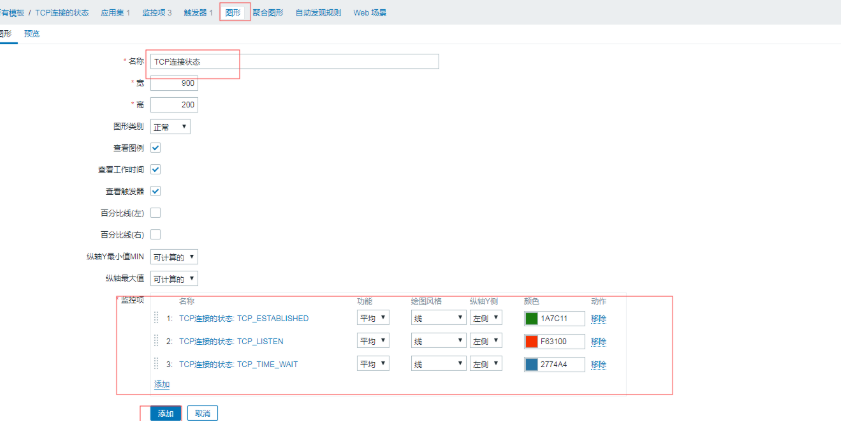
1.3创建图形
模版创建好,再次创建主机就可直接选择用
修改模版,可全部生效
例如:把时间修改成30天


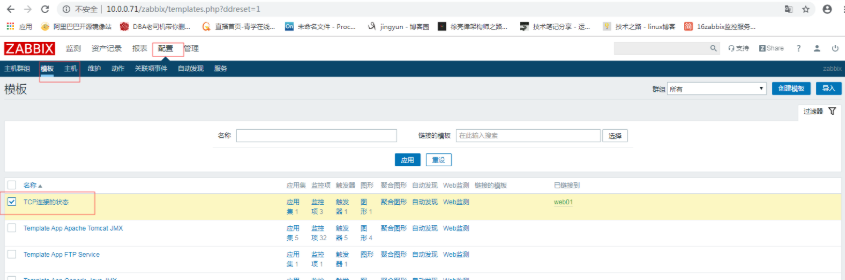
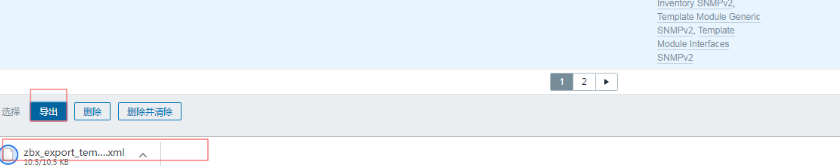
2.导出模版
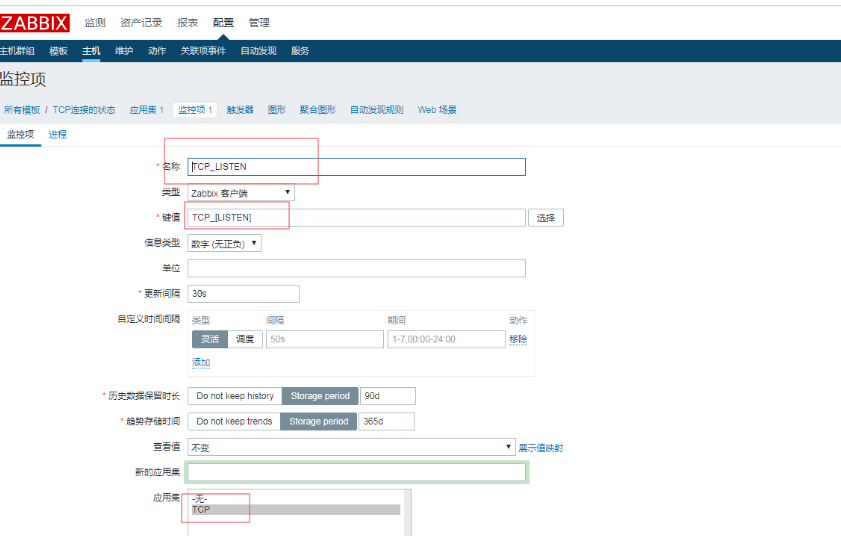
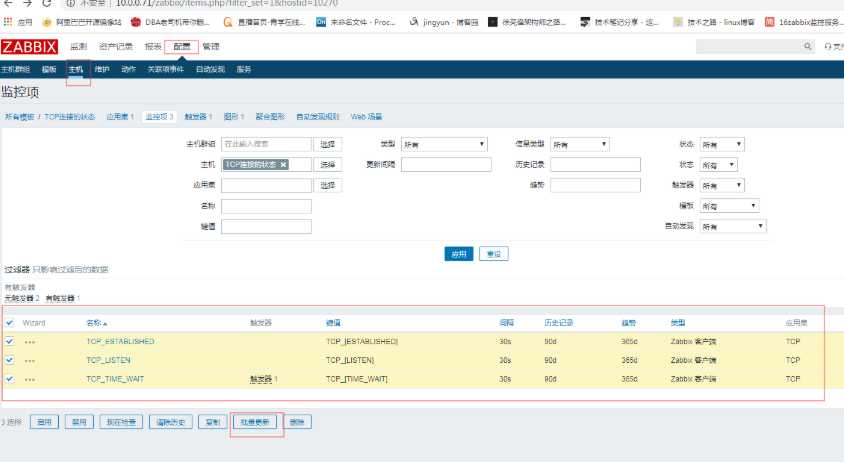
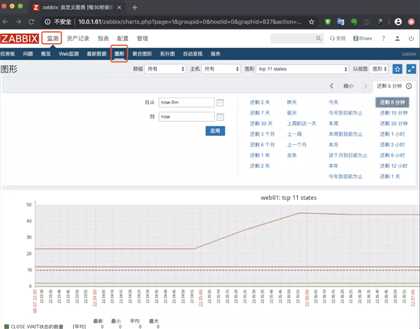
3.监控TCP11种状态
编写zabbix配置文件
[[email protected] /etc/zabbix/zabbix_agentd.d]# cat zbx_tcp.conf
UserParameter=ESTABLISHED,netstat -ant|grep -c 'ESTABLISHED'
UserParameter=SYN_SENT,netstat -ant|grep -c 'SYN_SENT'
UserParameter=SYN_RECV,netstat -ant|grep -c 'SYN_RECV'
UserParameter=FIN_WAIT1,netstat -ant|grep -c 'FIN_WAIT1'
UserParameter=FIN_WAIT2,netstat -ant|grep -c 'FIN_WAIT2'
UserParameter=TIME_WAIT,netstat -ant|grep -c 'TIME_WAIT'
UserParameter=CLOSE,netstat -ant|grep -c 'CLOSE'
UserParameter=CLOSE_WAIT,netstat -ant|grep -c 'CLOSE_WAIT'
UserParameter=LAST_ACK,netstat -ant|grep -c 'LAST_ACK'
UserParameter=LISTEN,netstat -ant|grep -c 'LISTEN'
UserParameter=CLOSING,netstat -ant|grep -c 'CLOSING'
3.2.重启zabbix-agent
[[email protected] ~]# systemctl restart zabbix-agent.service
3.3.测试监控项
使用zabbix-get命令测试
[[email protected] ~]# yum install zabbix-get.x86_64 -y
[[email protected] ~]# zabbix_get -s 10.0.1.7 -k ESTABLISHED
2
[[email protected] ~]# zabbix_get -s 10.0.1.7 -k LISTEN
12
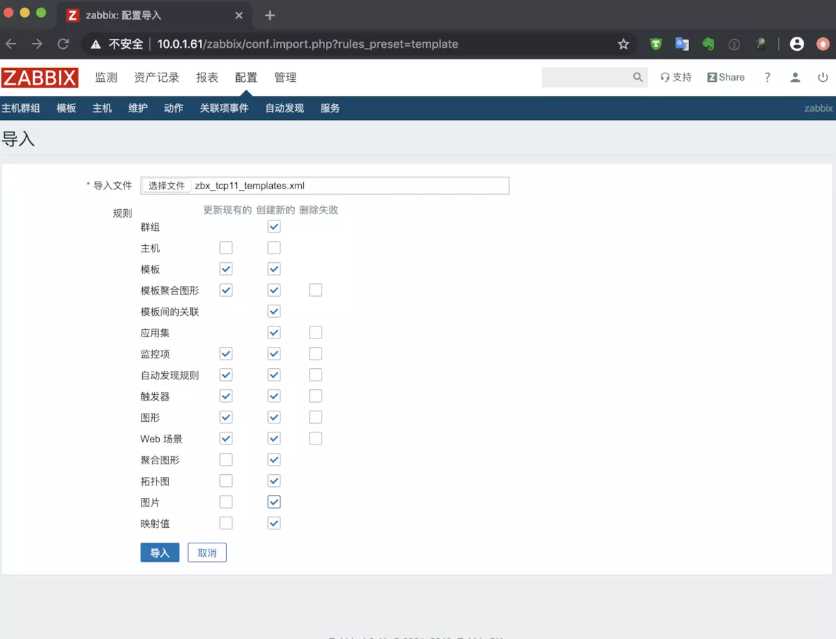
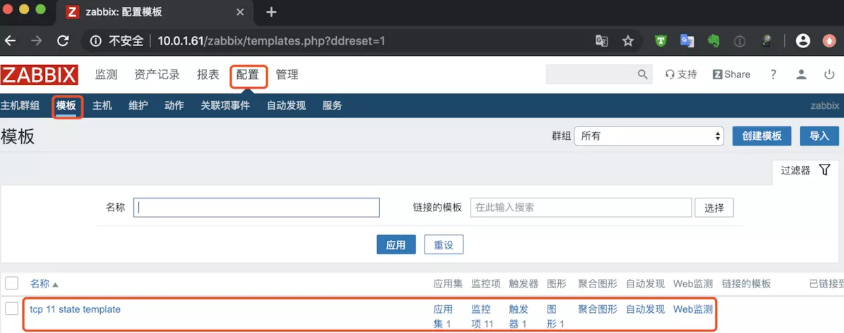
4.导入模版文件

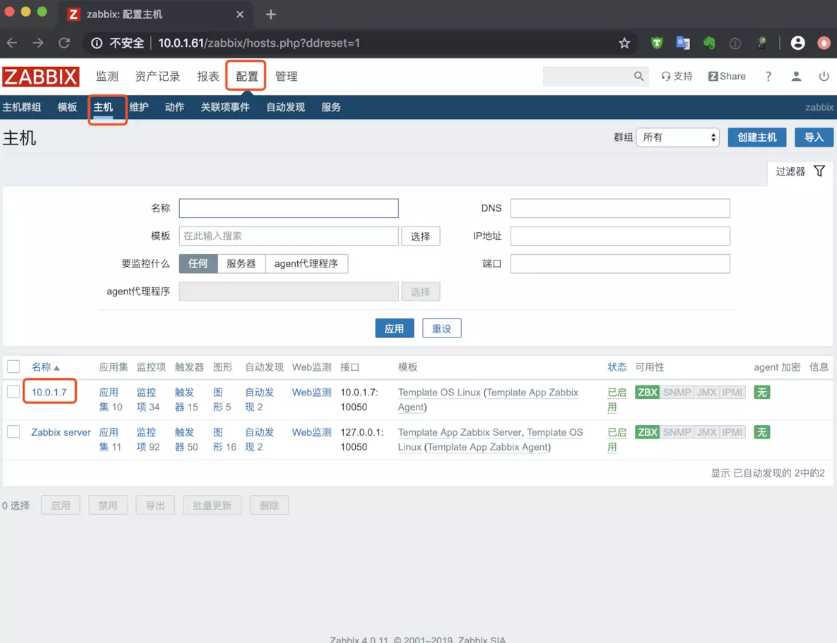
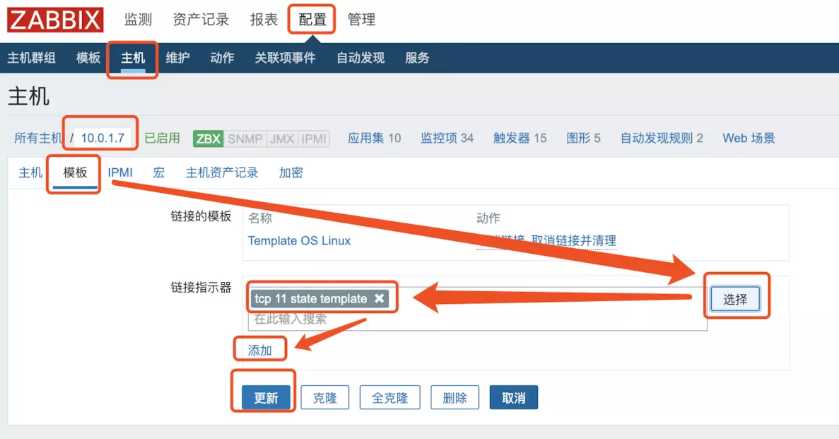
5.主机关联模版文件
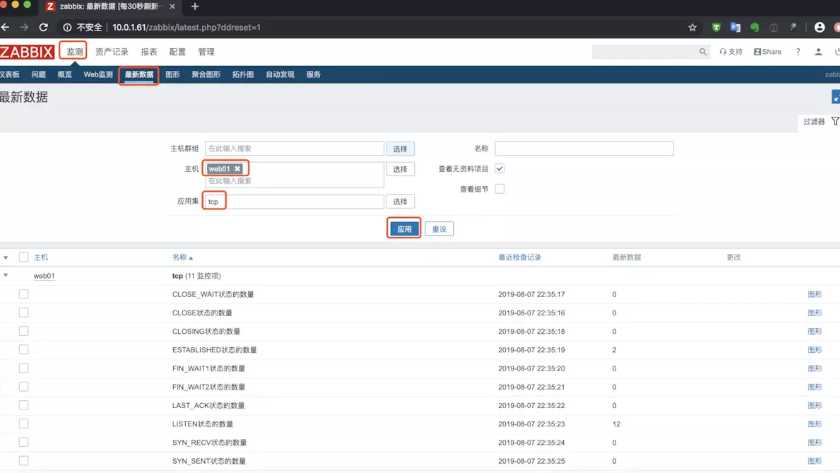
6.查看最新数据
7.查看图形
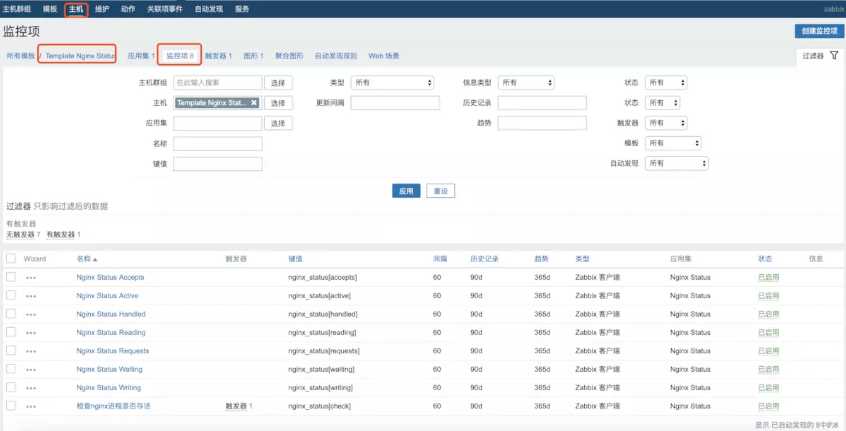
二、自定义模版监控nginx状态
1.开启监控页面并访问测试
[[email protected] ~]# cat /etc/nginx/conf.d/status.conf
server {
listen 80;
server_name localhost;
location /nginx_status {
stub_status on;
access_log off;
}
}
[[email protected] ~]# curl 127.0.0.1/nginx_status/
Active connections: 1
server accepts handled requests
6 6 6
Reading: 0 Writing: 1 Waiting: 0
2.准备nginx监控状态脚本
[[email protected] /etc/zabbix/zabbix_agentd.d]# cat nginx_monitor.sh
#!/bin/bash
NGINX_COMMAND=$1
CACHEFILE="/tmp/nginx_status.txt"
CMD="/usr/bin/curl "
if [ ! -f $CACHEFILE ];then
$CMD >$CACHEFILE 2>/dev/null
fi
# Check and run the script
TIMEFLM=`stat -c %Y $CACHEFILE`
TIMENOW=`date +%s`
if [ `expr $TIMENOW - $TIMEFLM` -gt 60 ]; then
rm -f $CACHEFILE
fi
if [ ! -f $CACHEFILE ];then
$CMD >$CACHEFILE 2>/dev/null
fi
nginx_active(){
grep 'Active' $CACHEFILE| awk '{print $NF}'
exit 0;
}
nginx_reading(){
grep 'Reading' $CACHEFILE| awk '{print $2}'
exit 0;
}
nginx_writing(){
grep 'Writing' $CACHEFILE | awk '{print $4}'
exit 0;
}
nginx_waiting(){
grep 'Waiting' $CACHEFILE| awk '{print $6}'
exit 0;
}
nginx_accepts(){
awk NR==3 $CACHEFILE| awk '{print $1}'
exit 0;
}
nginx_handled(){
awk NR==3 $CACHEFILE| awk '{print $2}'
exit 0;
}
nginx_requests(){
awk NR==3 $CACHEFILE| awk '{print $3}'
exit 0;
}
case $NGINX_COMMAND in
active)
nginx_active;
;;
reading)
nginx_reading;
;;
writing)
nginx_writing;
;;
waiting)
nginx_waiting;
;;
accepts)
nginx_accepts;
;;
handled)
nginx_handled;
;;
requests)
nginx_requests;
;;
*)
echo 'Invalid credentials';
exit 2;
esac
3.编写zabbix监控配置文件
[[email protected] ~]# cat /etc/zabbix/zabbix_agentd.d/nginx_status.conf
UserParameter=nginx_status[*],/bin/bash /etc/zabbix/zabbix_agentd.d/nginx_monitor.sh $1
[[email protected] ~]# systemctl restart zabbix-agent.service
4.使用zabbix_get取值
[[email protected] ~]# zabbix_get -s 10.0.1.7 -k nginx_status[accepts]
7
5.导入模版
6.链接模版

7.查看数据

![[转]Node.js中package.json中^和~的区别](/uploads/allimg/200519/054J34453_lit.png "[转]Node.js中package.json中^和~的区别")